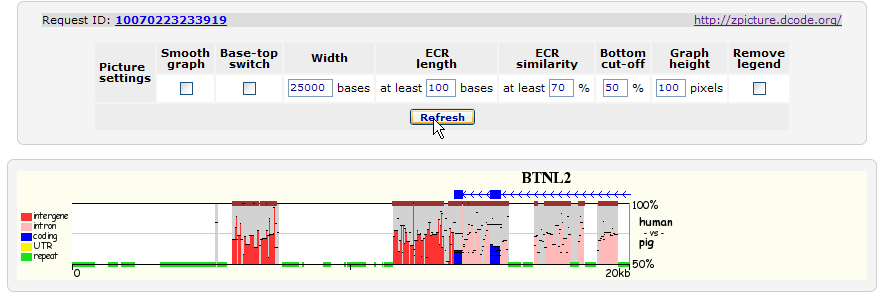


> BTNL2 gene |
 |

> 100 200 BTNL2 |


 Dot-plots indicate positional
relationships of between the aligned sequences at different parts of
the alignment. X- and y-axes
linearize the bottom and top sequences and the diagonal lines
illustrate ungapped alignments. The ends of each diagonal line
indicate the starting and ending coordinates of sequences that were
used to generate that particular ungapped
alignment. Forward strand alignments are colored in red; reverse strand
alignments are in blue. Sequence titles and
lengths are given at the ends of each axes.

13710 13720 13730 13740 13750 13760 |
